Runner, Repeater, Stranger Event
Which inventory should you stock? How much, of each type, should you store in raw materials, work in process, and finished goods? How often should you schedule production? What is your stocking strategy?
These were the questions posed to a manufacturing company during a recent Runner, Repeater, Stranger Inventory Analysis engagement.
The objectives of this engagement:
- Have enough inventory to ship, consistently, to customers
- Improve transparency of data and accuracy of information
- Build more trust in the process and create a system they can all utilize and build
- Increase profitability
- More independence from factory orders
During the analysis tgg and the company:
- Reviewed 18 months of shipped demand
- Corrected misidentified ‘strangers’ and modified the dataset
- Computed RRS classifications and Kanban min/max classifications
- Initiated initial stock order
By the end of this four-week engagement the company had:
- Lean overview training
- Increased refresh rates for both inventory & spare parts from every 24 hours to every hour
- Reviewed info inventory codes
- Reviewed current ways to check inventory
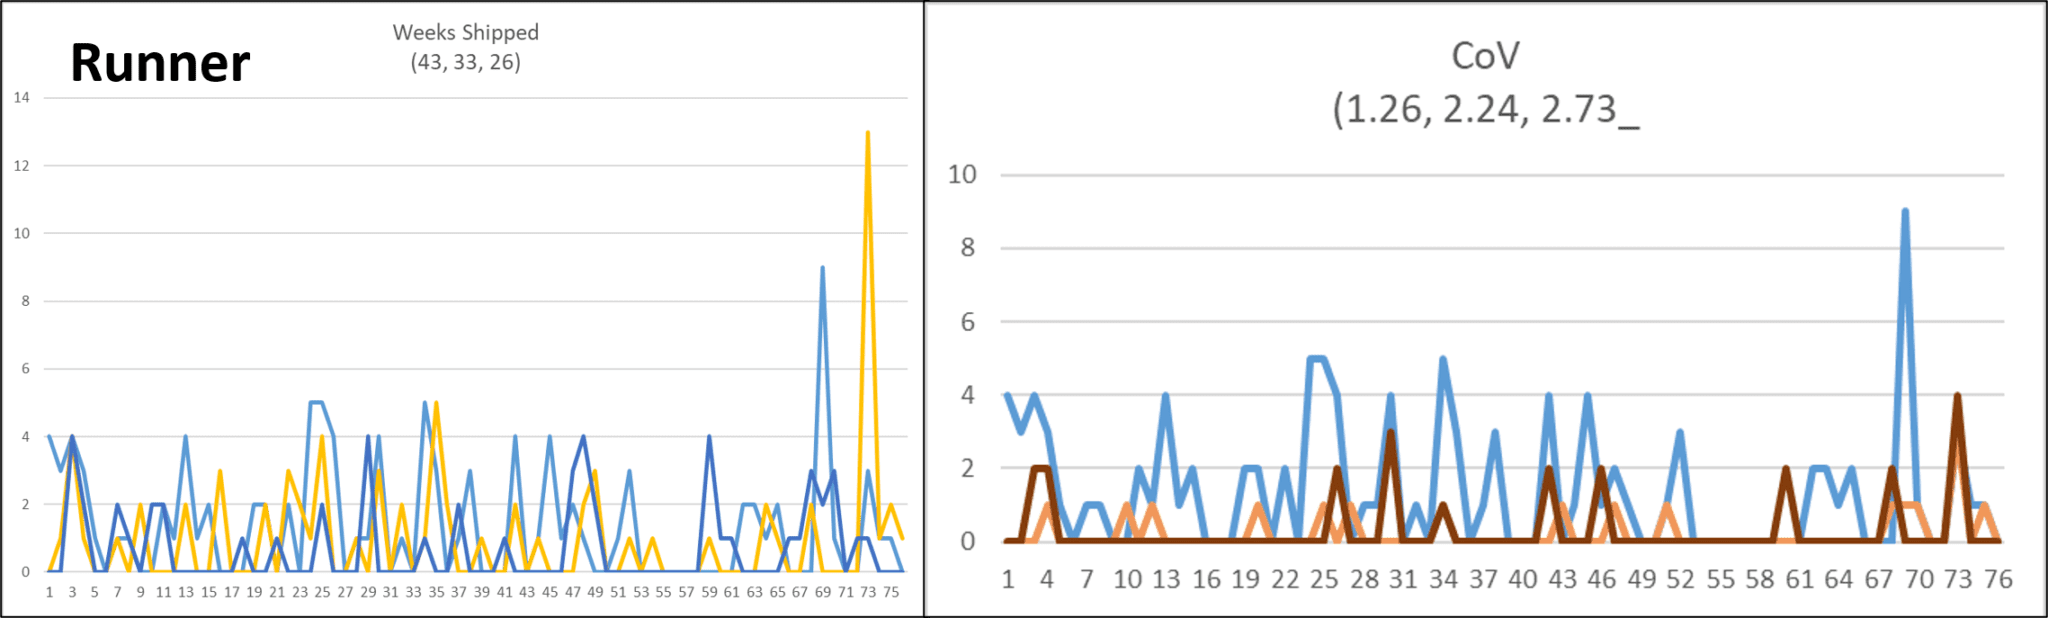
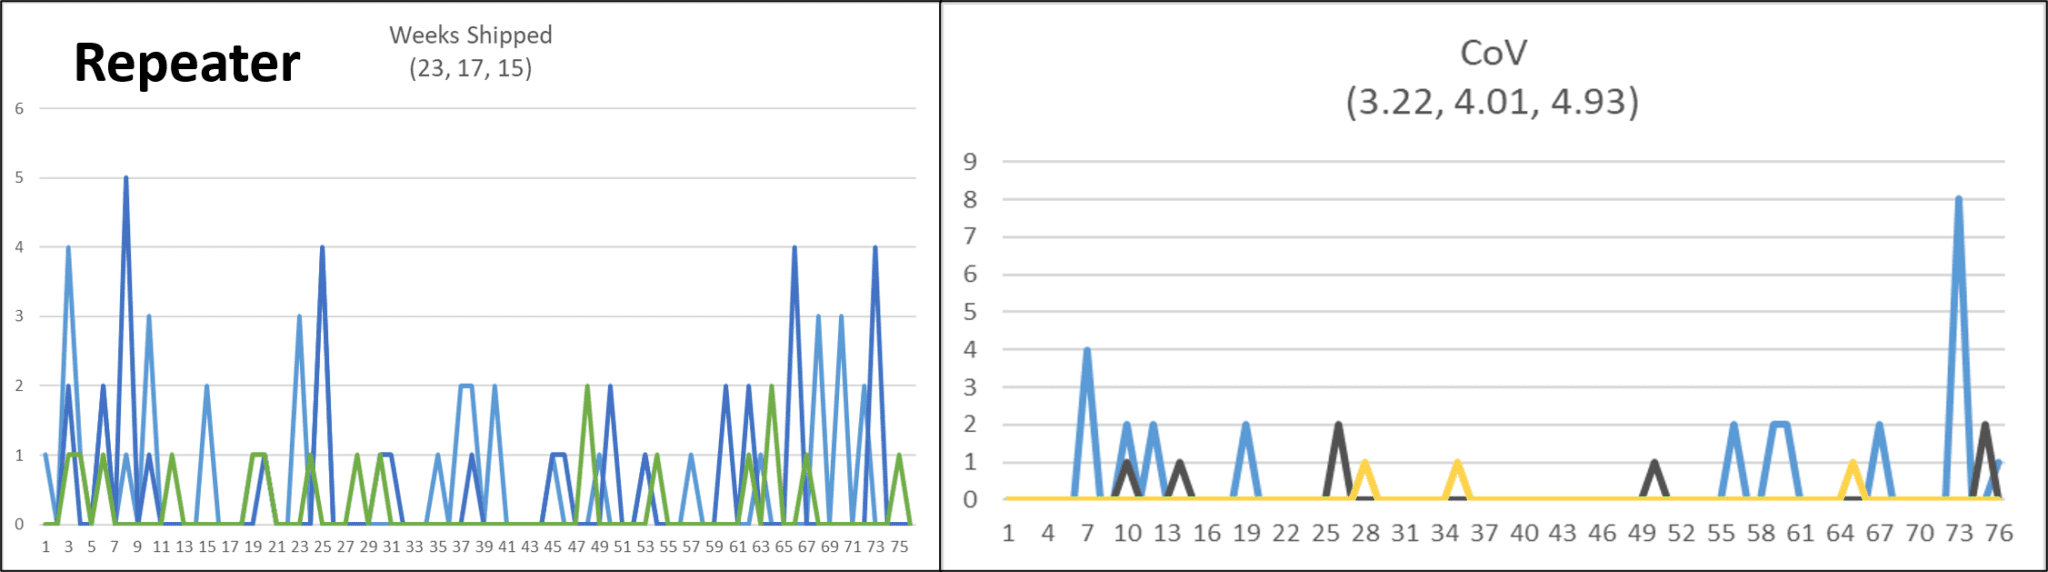
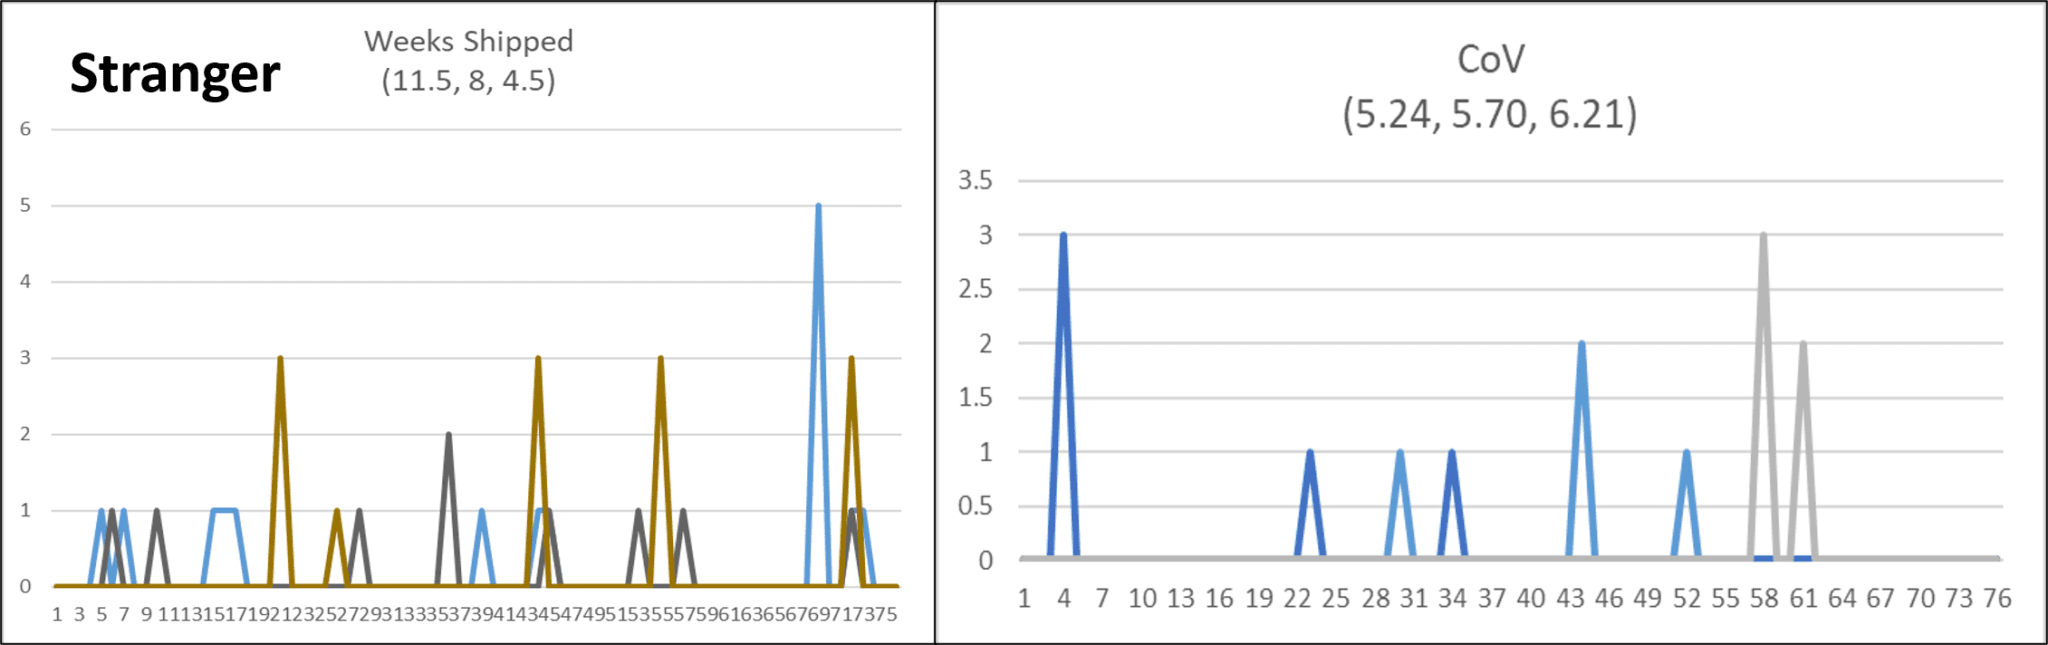
Graphs and Report Outs
The below graphs represent the data from the analysis. This side-by-side comparison for each type (Runner, Repeater, Stranger) shows weekly shipped orders on the left with the coefficient of variation on the right.
If you had difficulty answering any of the above questions, the Runner, Repeater, Stranger (RRS) Inventory Analysis might be just the tool for you. With this thorough statistical analysis, tgg can help your organization not only answer ‘how much inventory’, but also create a standard run strategy and schedule to maintain these levels. Move from 4+ weeks of lead time with 25% forecast accuracy to 1+ week lead with 75% accuracy.
Click here to learn more about the RRS Analysis or contact us!